Monitoring & Observability Services
End-to-End Observability That Powers Uptime
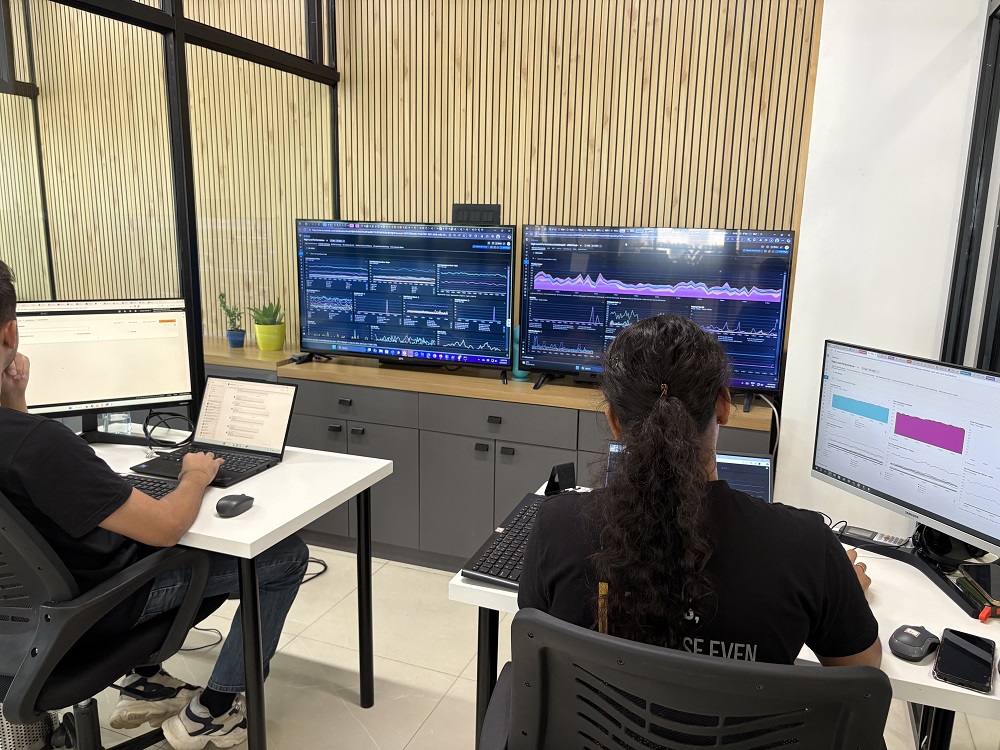
When systems scale, observability becomes mission-critical. At IAMOPS, we enable high-growth companies to monitor their infrastructure, applications, and services with precision, helping engineering teams reduce downtime, resolve incidents faster, and build user trust.
From real-time metrics to intelligent alerts and dashboarding, we implement full-stack monitoring strategies that ensure nothing gets missed.
Monitoring Stack We Use
 Prometheus
We configure Prometheus for cloud-native, time-series metrics collection that is purpose-built for Kubernetes environments. We deploy custom exporters to gather detailed metrics from services and infrastructure, and set up Alertmanager to define precise rules, escalation policies, and alert delivery workflows
Use cases:
- Kubernetes cluster monitoring
- Infrastructure health checks
- Real-time alerting for service failures.
 Grafana
We build rich, customizable Grafana dashboards that present real-time insights from multiple data sources including Prometheus, Loki, Elasticsearch, and InfluxDB. These dashboards are tailored to various stakeholders, offering engineers, SREs, and management teams a clear and actionable view of system health.
Use cases:
- Multi-source metric visualization
- Cross-team performance dashboards
- Alert trend analysis
 Datadog
We use Datadog to bring together application performance monitoring, infrastructure metrics, logs, and distributed traces in a single SaaS platform. We configure machine learning–based anomaly detection to proactively identify issues before they impact performance or availability.
Use cases:
- Distributed tracing for microservices
- Anomaly detection in production environments
- Full-stack monitoring across cloud and containers
 PagerDuty
To enhance incident response, we integrate PagerDuty for on-call scheduling, automated escalations, and real-time alert routing. Our configurations ensure accurate MTTA and MTTR tracking, helping high growth teams respond faster and stay aligned with their SLAs.
Use cases:
- Escalation workflows for production incidents
- Managing global on-call teams
- Real-time SLA tracking
 UptimeRobot
We implement UptimeRobot for lightweight, continuous monitoring of APIs and public endpoints. Alerts are set up across email, SMS, and webhooks, seamlessly tying into existing alert stacks to provide a simple yet effective layer of uptime visibility.
Use cases:
- API availability checks
- Endpoint health monitoring
- Early detection of service disruptions
Our Monitoring Services
Monitoring Architecture Design
- Define observability goals and key metrics
- Select the right stack based on your environment
- Plan integration with CI/CD, GitOps, and infrastructure as code
Implementation & Configuration
- Setup metric scraping and service discovery
- Create custom dashboards for services, APIs, databases
- Configure alerts, thresholds, and incident playbooks
Incident Response Enablement
- Integrate with PagerDuty, Slack, email, and webhooks
- Configure escalation chains and fallback responders
- Automate alert deduplication and suppression
Why IAMOPS for Monitoring?
- Unified visibility across metrics, logs, and traces
- Fast implementation with pre-built integrations
- Kubernetes-native monitoring expertise
- Built-in support for SLAs, SLOs, and compliance
- Alerting strategies that balance signal vs noise
Let IAMOPS help you monitor smarter, resolve faster, and operate with confidence.


